- superadmin
- No Comments
What is Candlestick Chart?
Candlesticks reflect a lot of about the market direction. If we only look at price, we can’t figure out if it’s overbought or over sold. We can’t figure out if it’s at a low price that we should start buying nor can we figure out an edge of the market. We want to reduce the risk that we are taking. So we look at candlesticks and let them give us an insight so we can then put some capital at risk and hope to make profit.
How to read?
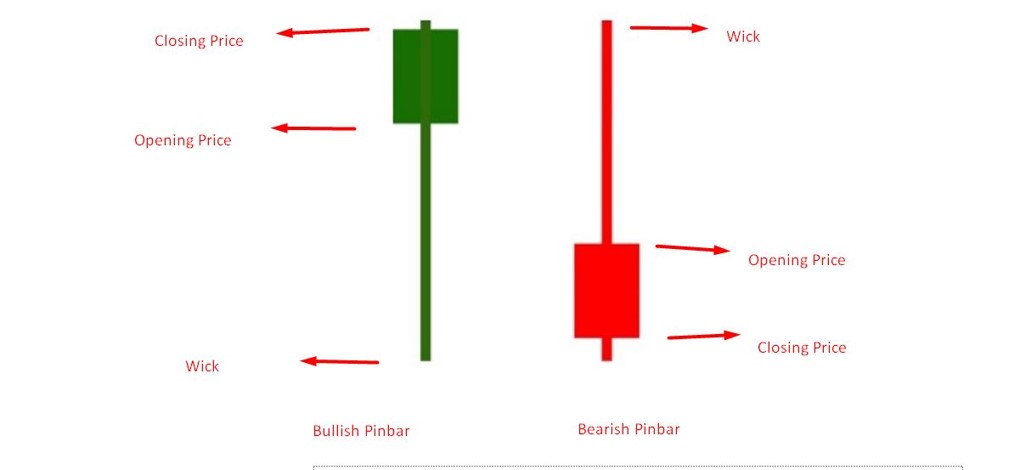
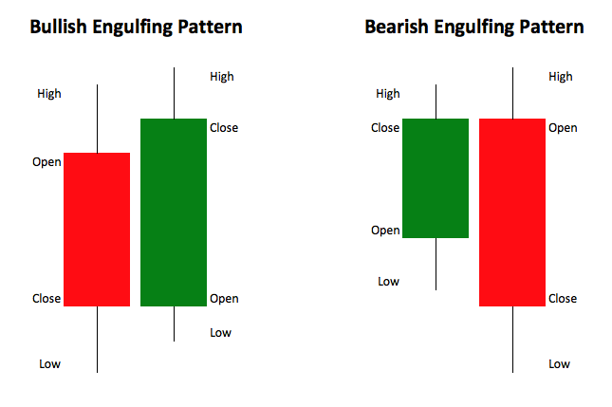
There are two types of setups, the bearish pinbar on the right and the bullish pinbar on the left.
Bullish means going up and bearish means going down.
So on the left, you can see the opening price and let’s say this is a daily chart, within the day, the market went as low as this price (where the wick ends), so you see that the sellers came in and drove the price all the way down. But before the end of the day, the buyers came in and push the price back up to the closed price.
The market is like a tug-of-war between buyers and sellers. If buyers are stronger, the prices go up, if the sellers are stronger, the prices go down. Candlestick reflects the market, it tells us that the price is falling and falling, but then the market has gotten to a support level and the buyers are very defending, making the closing price even higher than the opening price.
The opposite case is the bearish pinbar, the market opens at that price and buyers came and push the price all the way up, but at the end of the day, the sellers came in and started defending that level and pushing the price lower and lower, eventually closing lower than the opening price.
Example
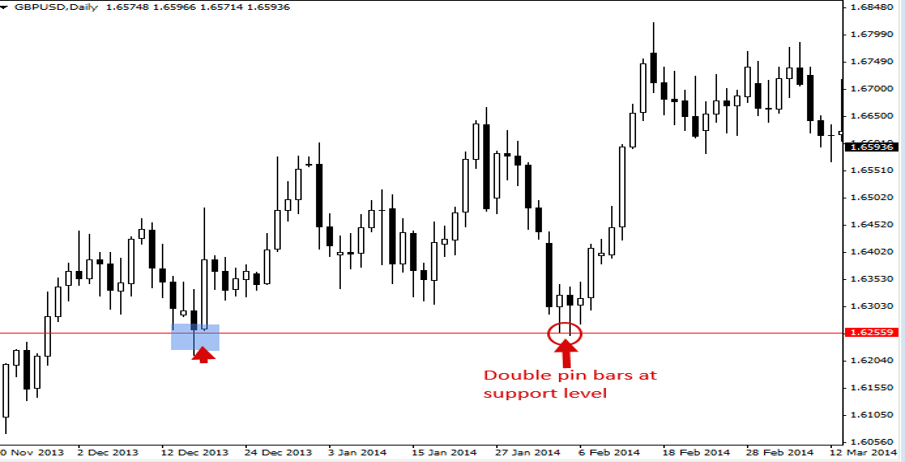
Here’s an example, you see the price getting close to the support, you see how buyers came in to push the price upwards.
On the right, we have a double pinbar. The market came close to the support line and you see how sellers pushed the price down and buyers came and pushed it back up. The next day, sellers again came back to support area and buyers defended again.
So what’s important is that the candle has a long wick and a short head (view body is small compare to the whole week), when you see this type of setup, it is a bullish setup and you can see how the market rallied.
So, as a new trader, knowing how to read candlestick will help simplify a lot of the noise.
The shapes and size of candlesticks can give us an insight into what could possibly occur and how the price may move. Each candle sticks represents what has transpire in the market within a specific period of time.
Understanding some key candlestick patterns or combination of candlestick can turn you into a profitable if used properly.
Recent Comments